Group project
ML Classifier Visualiser
Built with a team at the University of Nottingham, this desktop app shows how machine learning classifiers make decisions, using clear visual boundaries instead of raw numbers.
What it does
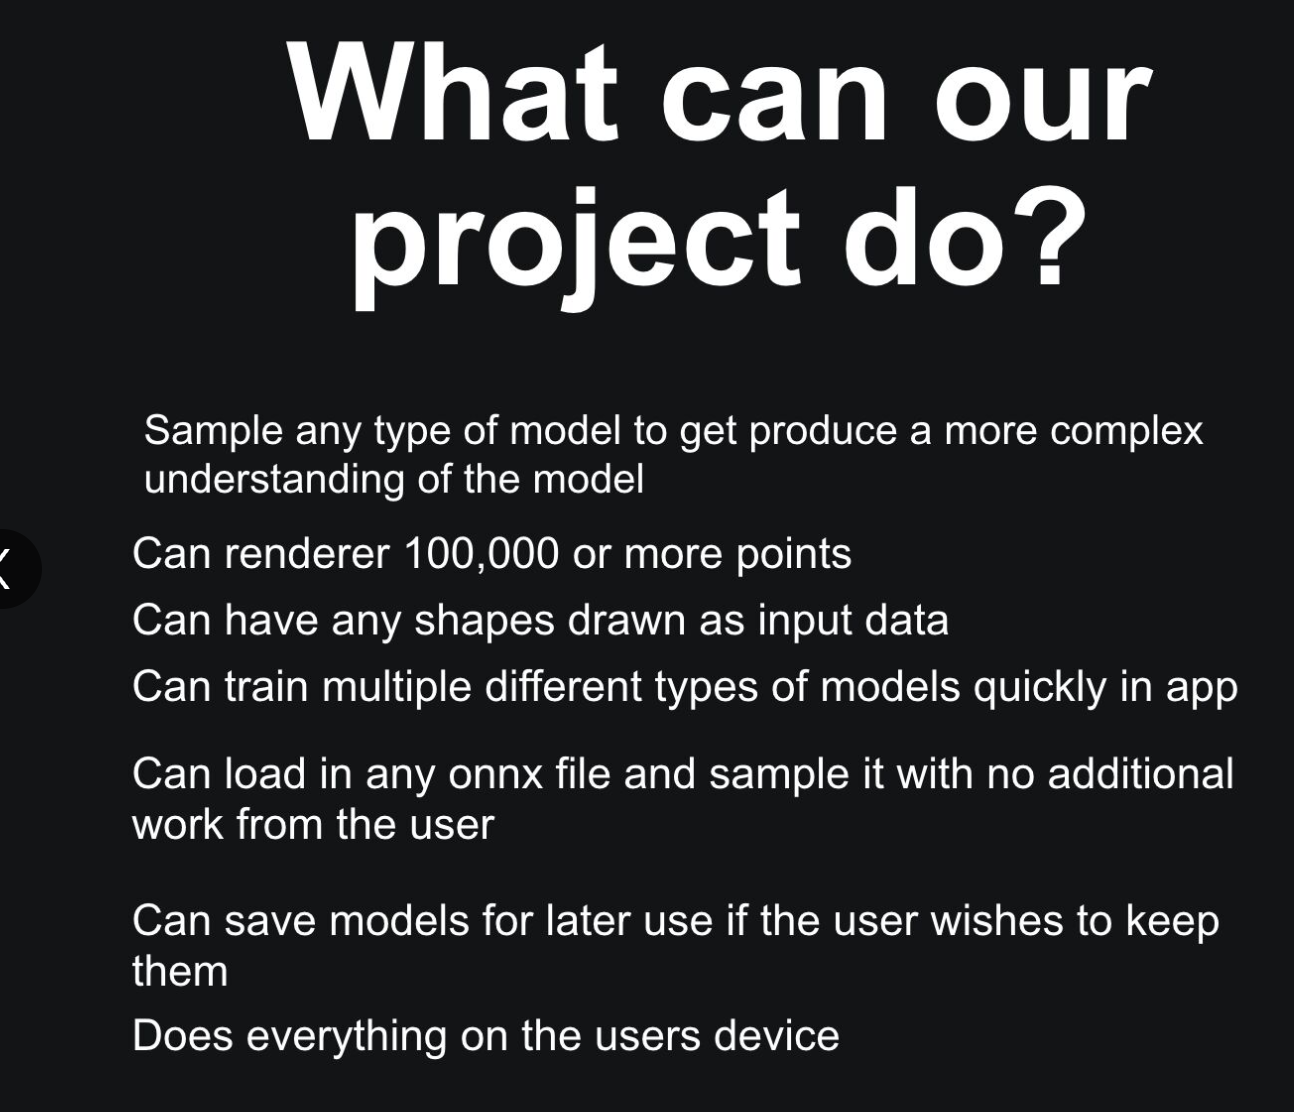
The app loads ONNX models and renders their decision boundaries in 2D and 3D, so you can see how a classifier separates data rather than just reading a score.
- Loads ONNX models with no extra setup
- Renders decision boundaries in 2D and 3D
- Trains and evaluates models directly in the app
- Runs entirely locally, so no data leaves your device
How it processes data
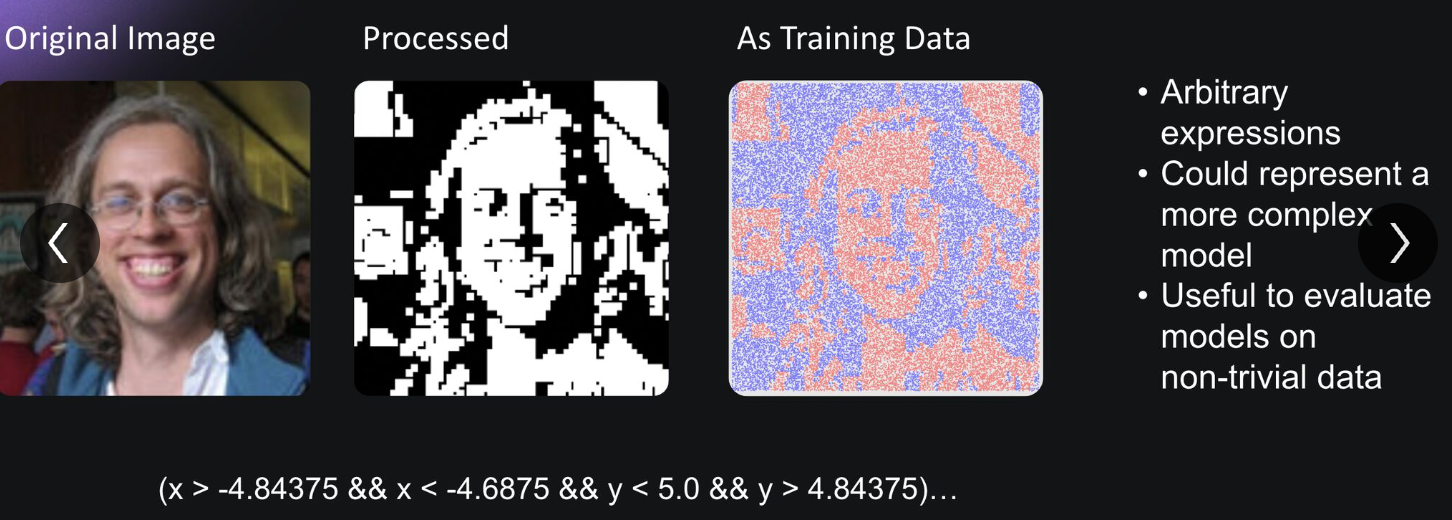
Inputs are converted into a training format that lets classifiers interpret complex shapes as mathematical boundaries. The canvas stays interactive even at scale.
- Supports custom expressions
- Handles over 100,000 points in real time
- Fully interactive, zoomable canvas
Why we built it
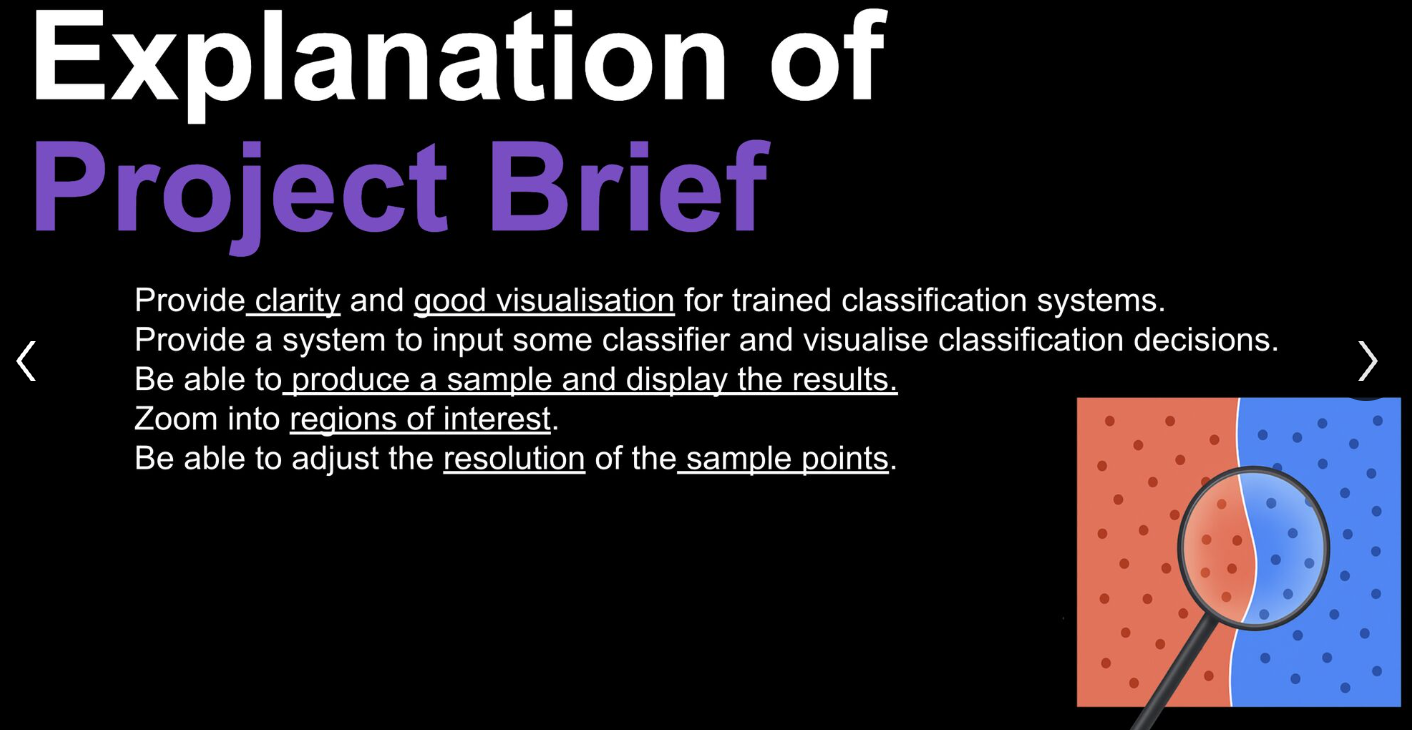
Our goal was to make classifier decisions easier to understand. Users can zoom into areas of interest, adjust sampling resolution, and see where a model performs well or struggles.
Technologies
- Python for model training, logic and sampling
- Java with OpenGL for the interactive interface
- gRPC and Protocol Buffers to connect the two
- ONNX for model portability
This split gave us real-time performance while keeping the backend and frontend cleanly separated.
Reflection
This project earned a First in our Software Engineering module. More than the grade, it taught us how to collaborate across a shared codebase, design a usable interface, and get an ML system running end to end.
Thanks to my teammates and to Dr Andrew Parkes for guidance throughout.